Understanding the Employer Health Benefits Experience
Company
Allshores (formerly Argus)
Role
Customer Experience Analyst
Timeline
~8 weeks
Methods
Surveys Interviews Desk research Thematic analysis
01. Overview
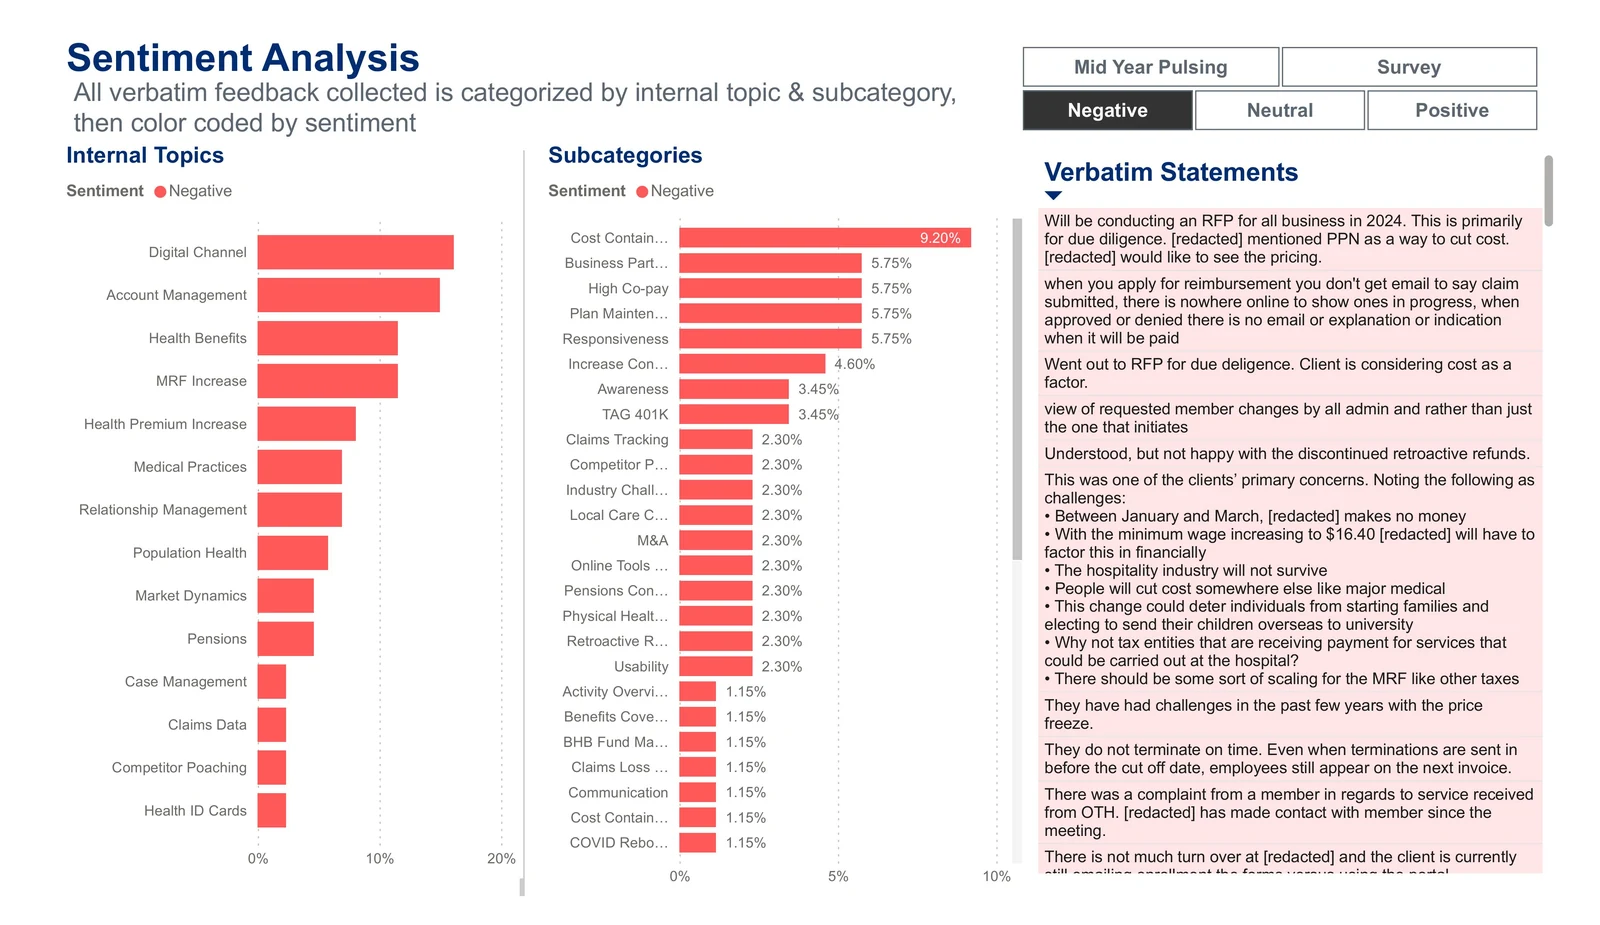
At Allshores, I led a quarterly Voice of Customer study focused on HR administrators responsible for managing employee health benefits. The study combined survey responses with qualitative customer feedback, CRM complaints, and account-management data to assess the overall client experience and identify areas requiring further investigation. I owned the project end to end, including survey design and launch, quantitative and qualitative analysis, synthesis, and stakeholder reporting. I also designed an interactive Power BI dashboard that allowed teams to explore customer satisfaction measures, experience drivers, feedback themes, segments, and supporting verbatim responses in one place.
4
Data sources triangulated
33
survey respondents
7
CX measures assessed
02. Problem
Customer feedback was being collected across several sources, but there was no consistent view of which issues were most important or how they related to overall satisfaction and loyalty.
The study focused on one primary question:
Which parts of the HR Admin experience had the strongest relationship with customer satisfaction and likelihood to recommend, and where were the most consistent areas for improvement?
We also aimed to establish a set of measures that could be compared across future reporting cycles.
03. Approach
I built on the previous VoC cycle by preserving core NPS and CSAT measures while refining the study around emerging customer pain points. I combined survey, interview, CRM, and operational data, then synthesized the findings into an interactive Power BI dashboard used for stakeholder reporting and decision-making.
01
Refine
Updated the prior survey using previous findings while retaining core measures for comparison.
Synthesized themes and compared qualitative findings against NPS, CSAT, and operational measures.
04
Build & Share
Built an interactive Power BI dashboard and presented the findings to stakeholders.
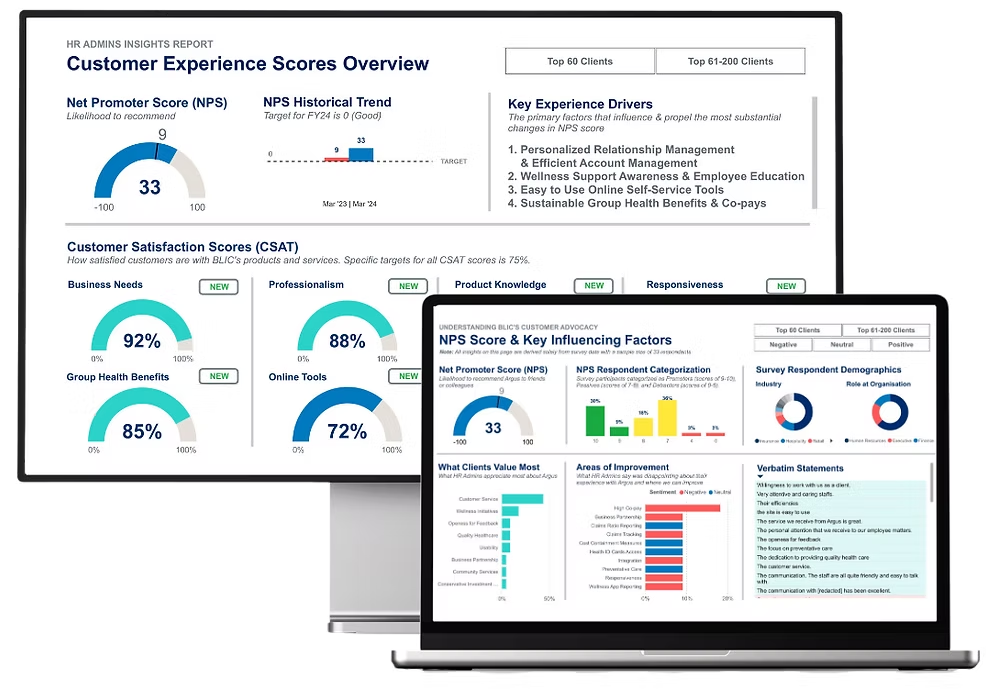
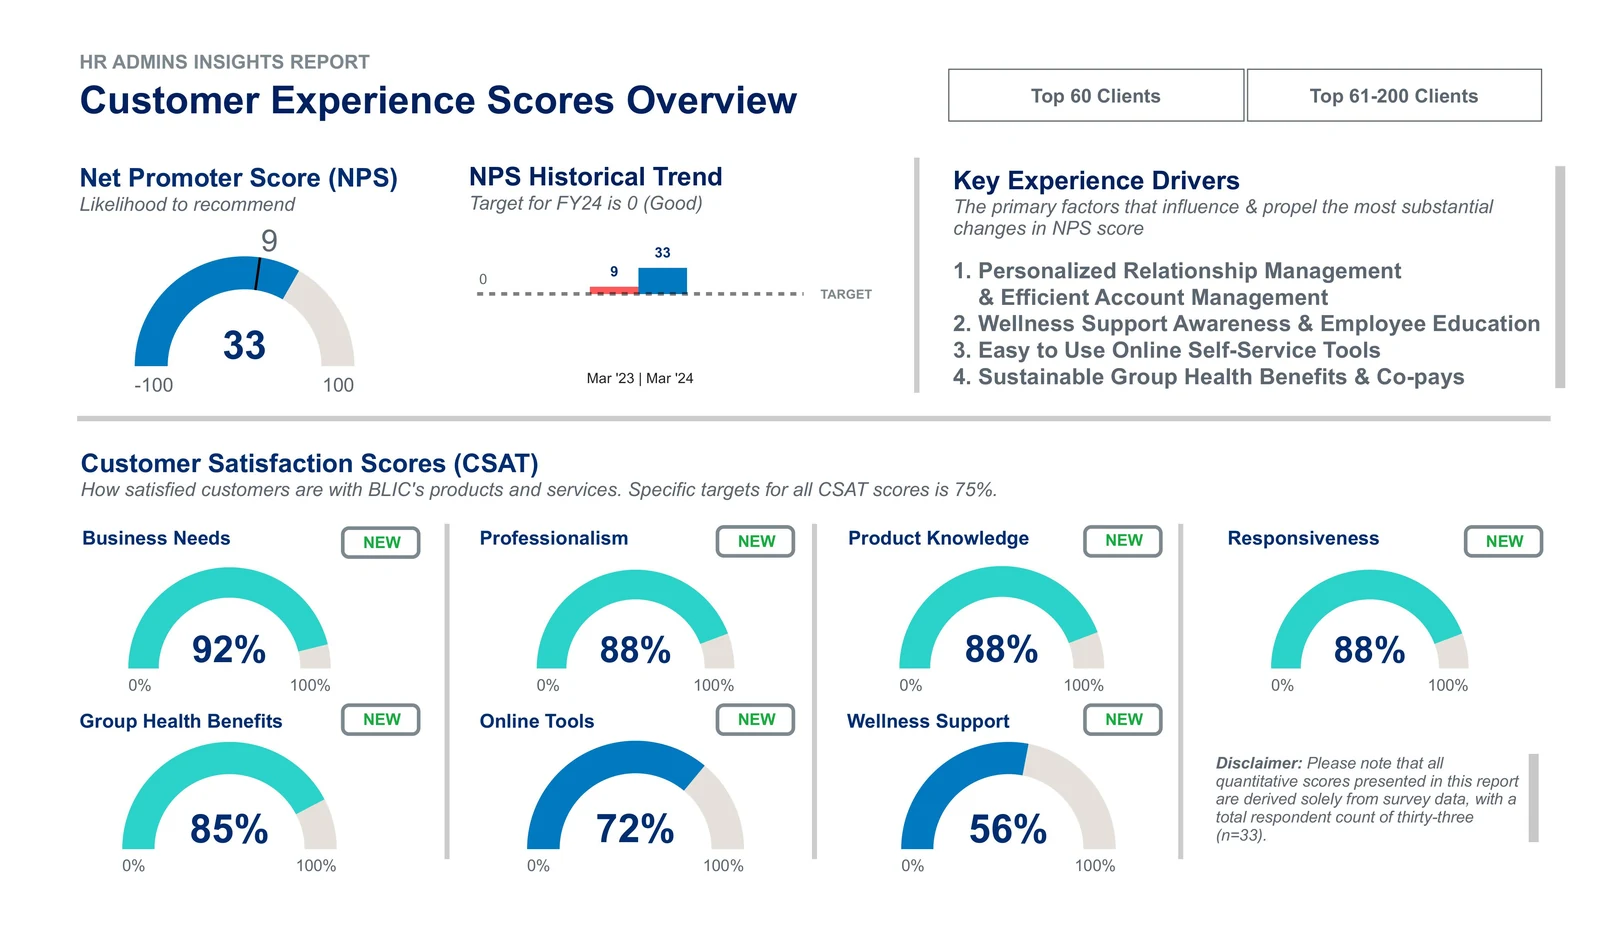
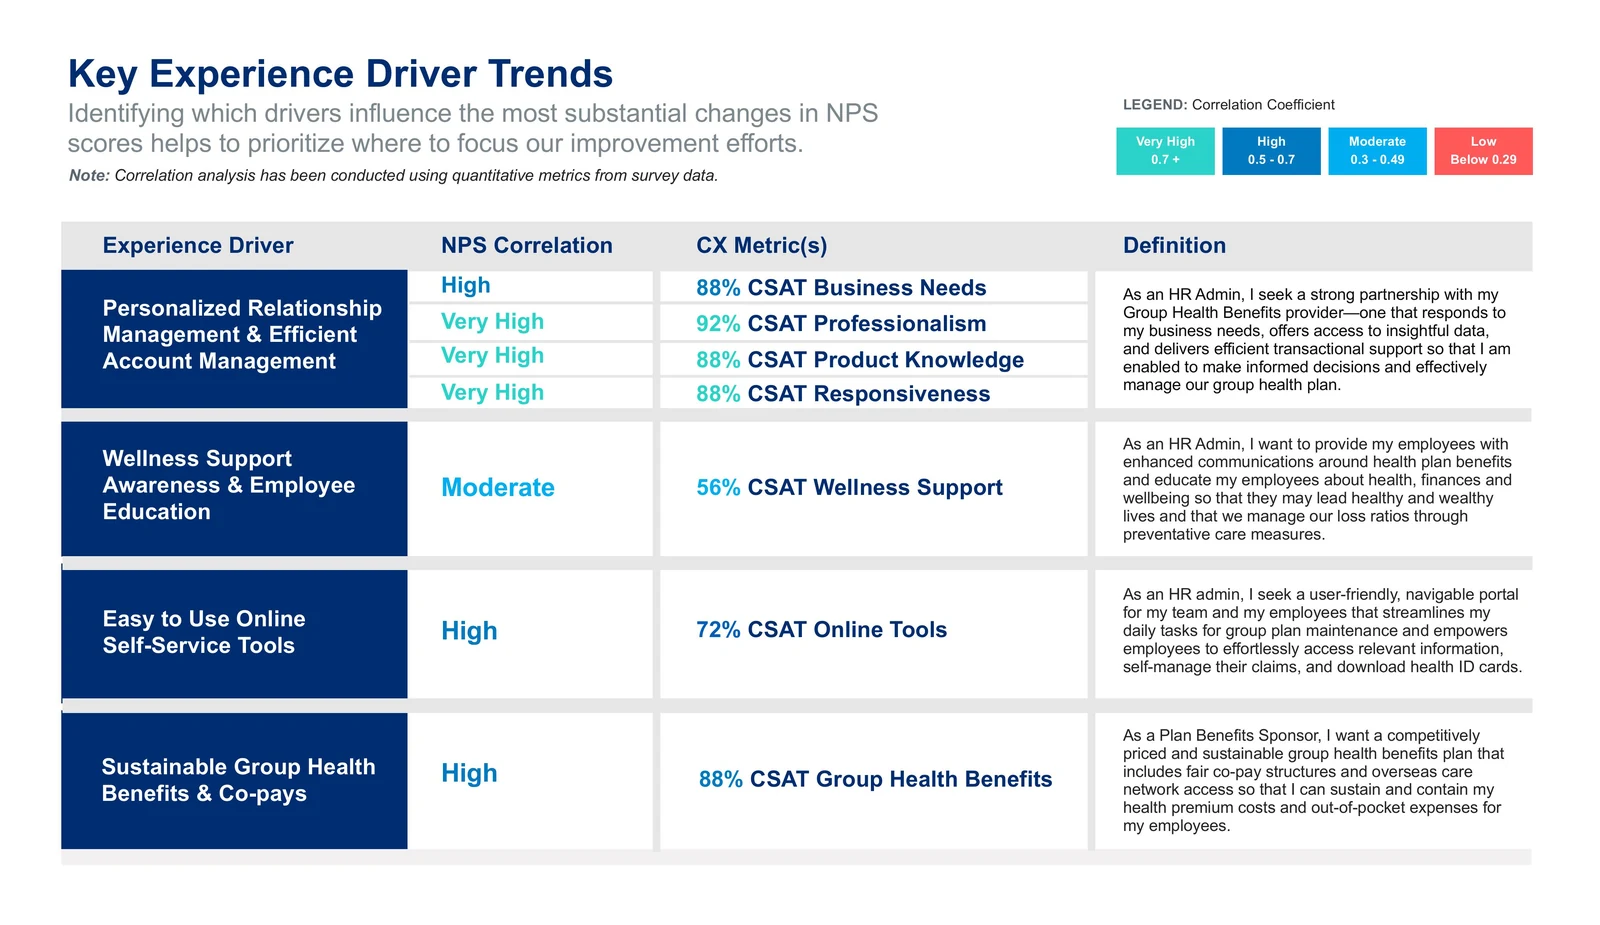
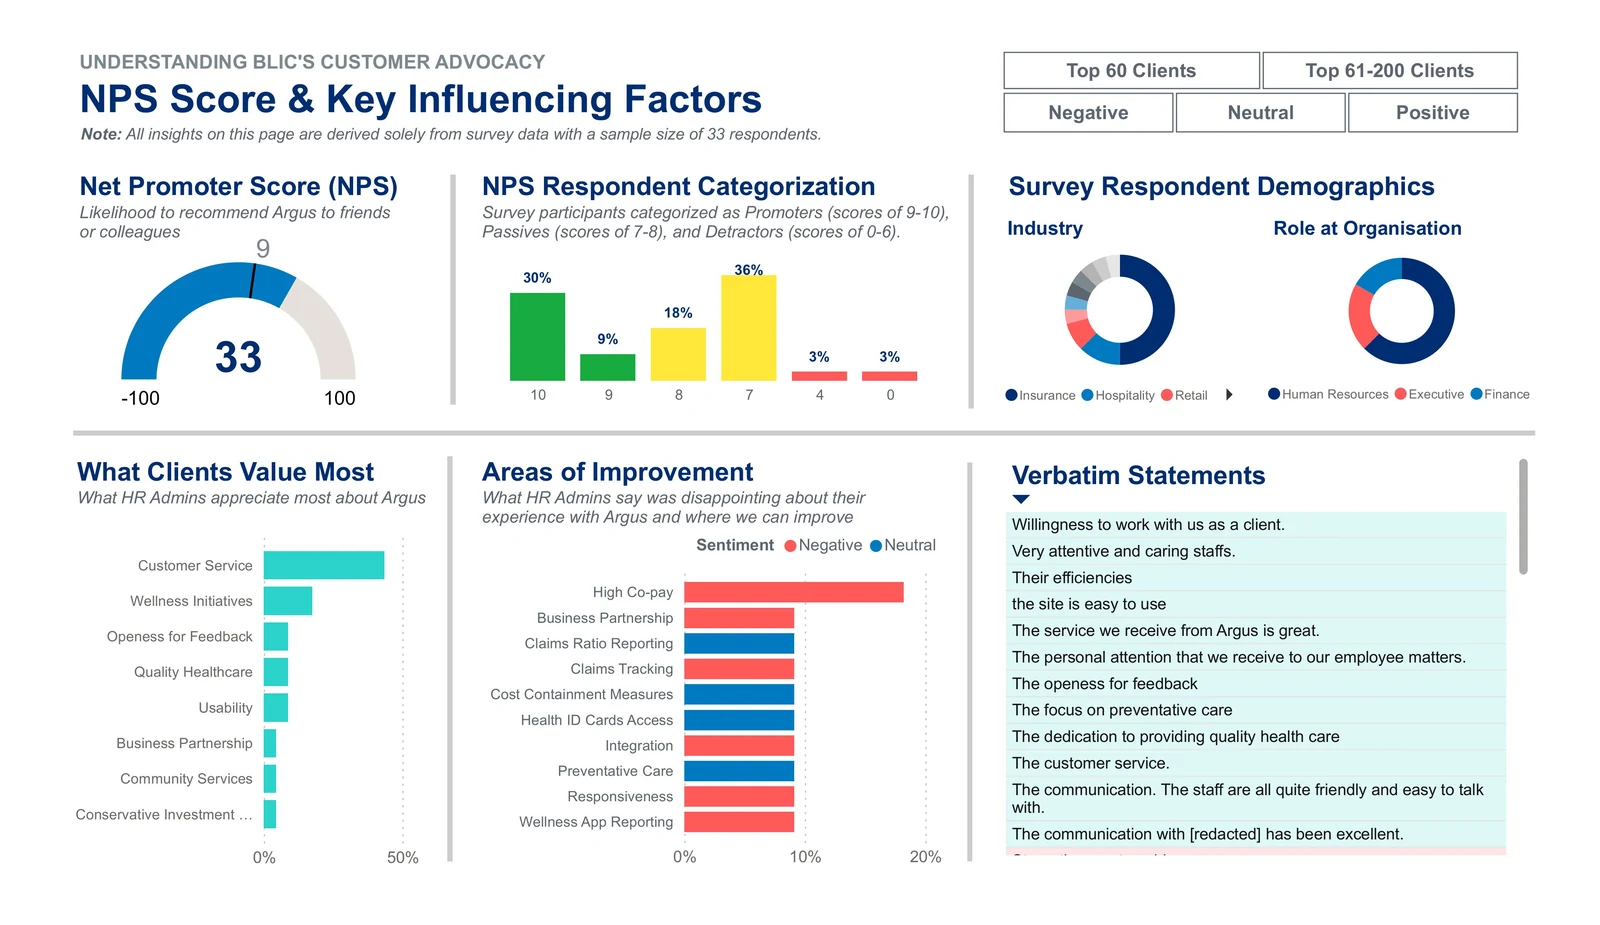
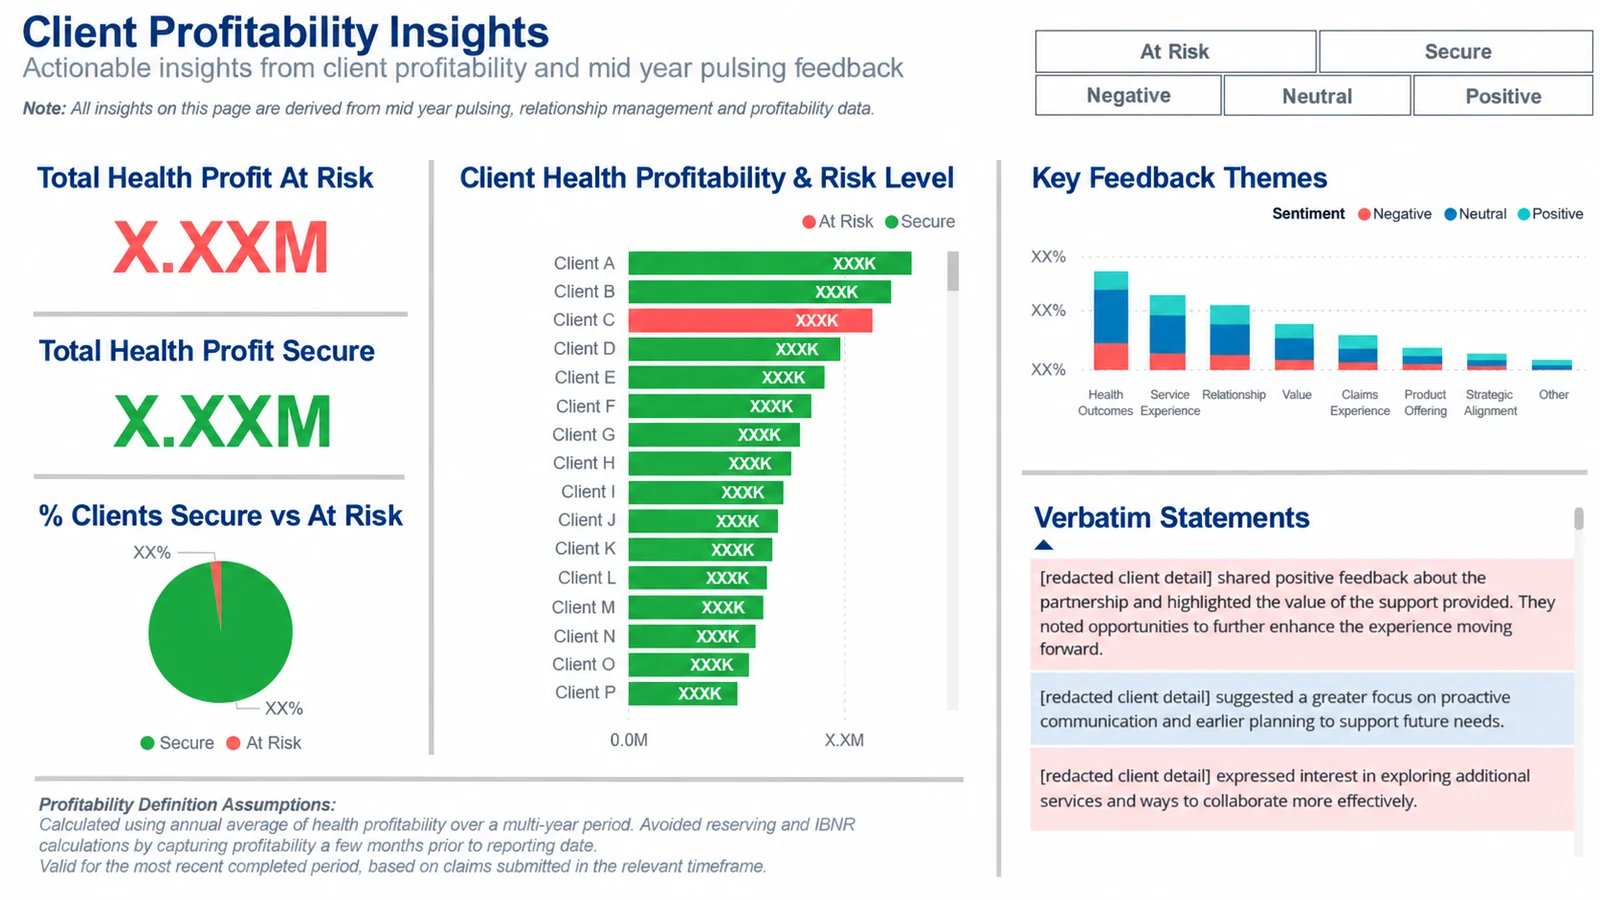
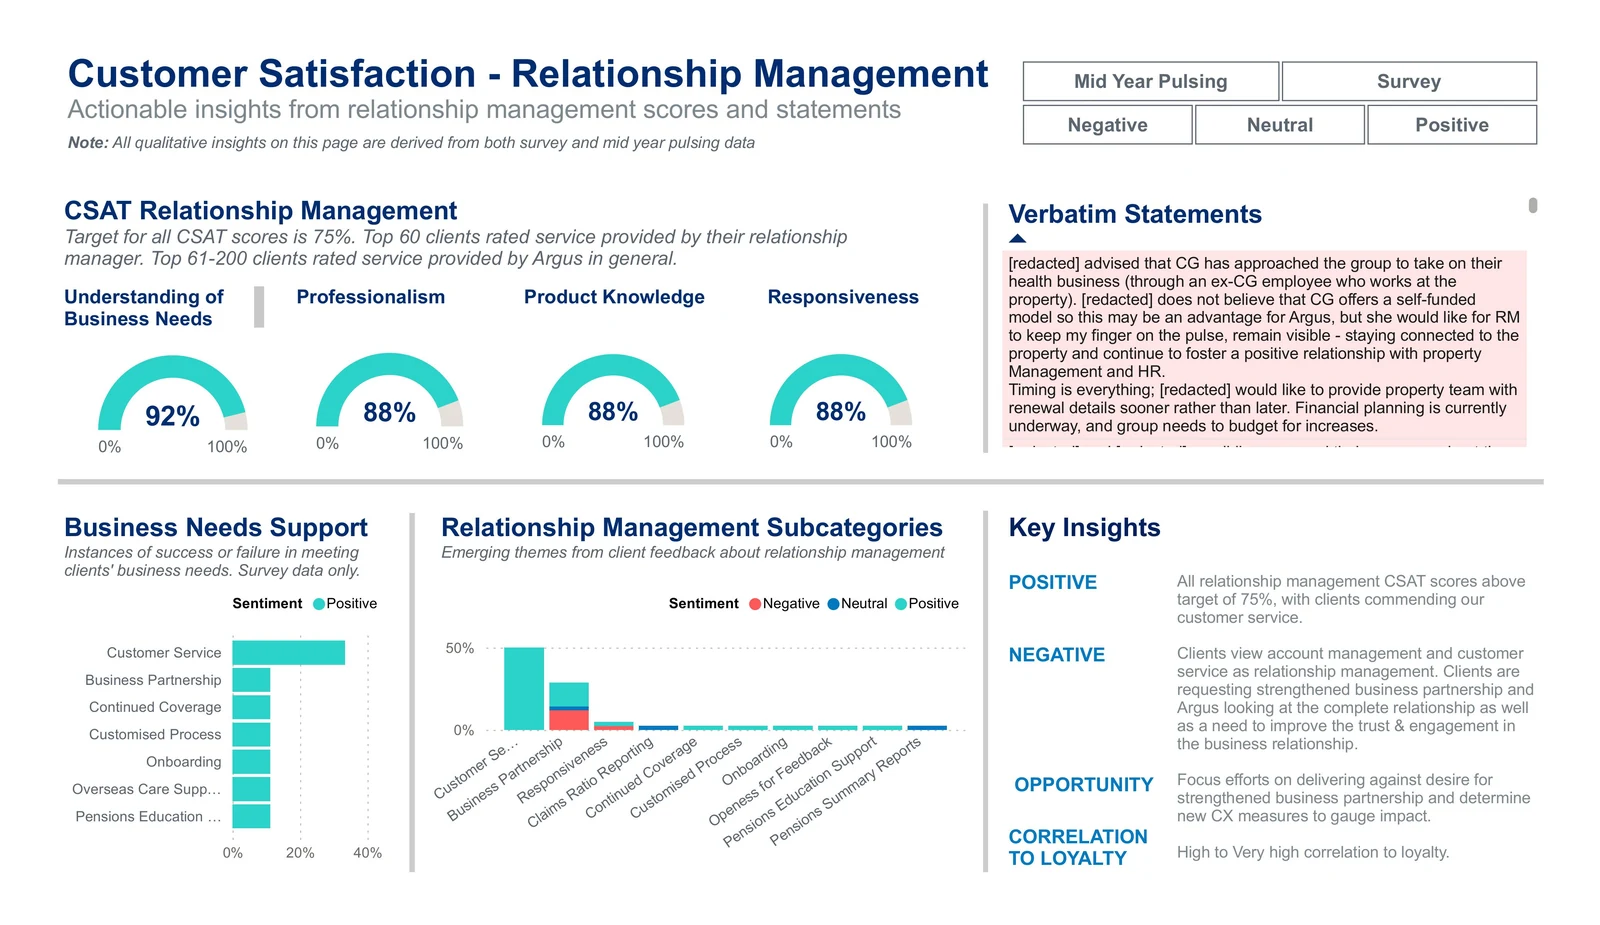
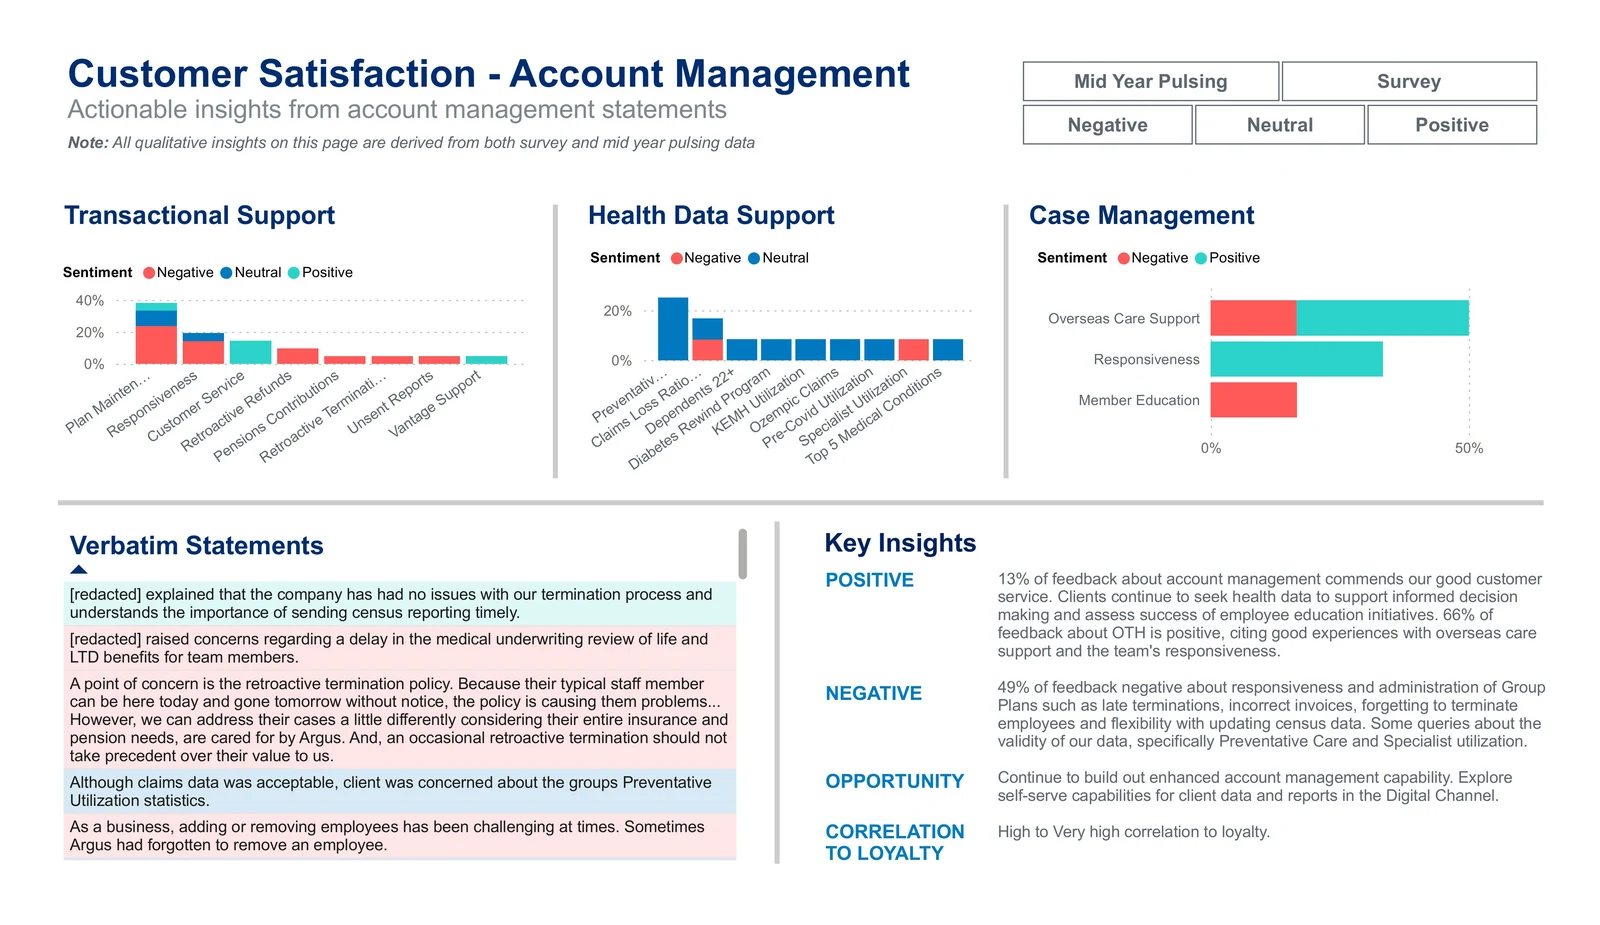
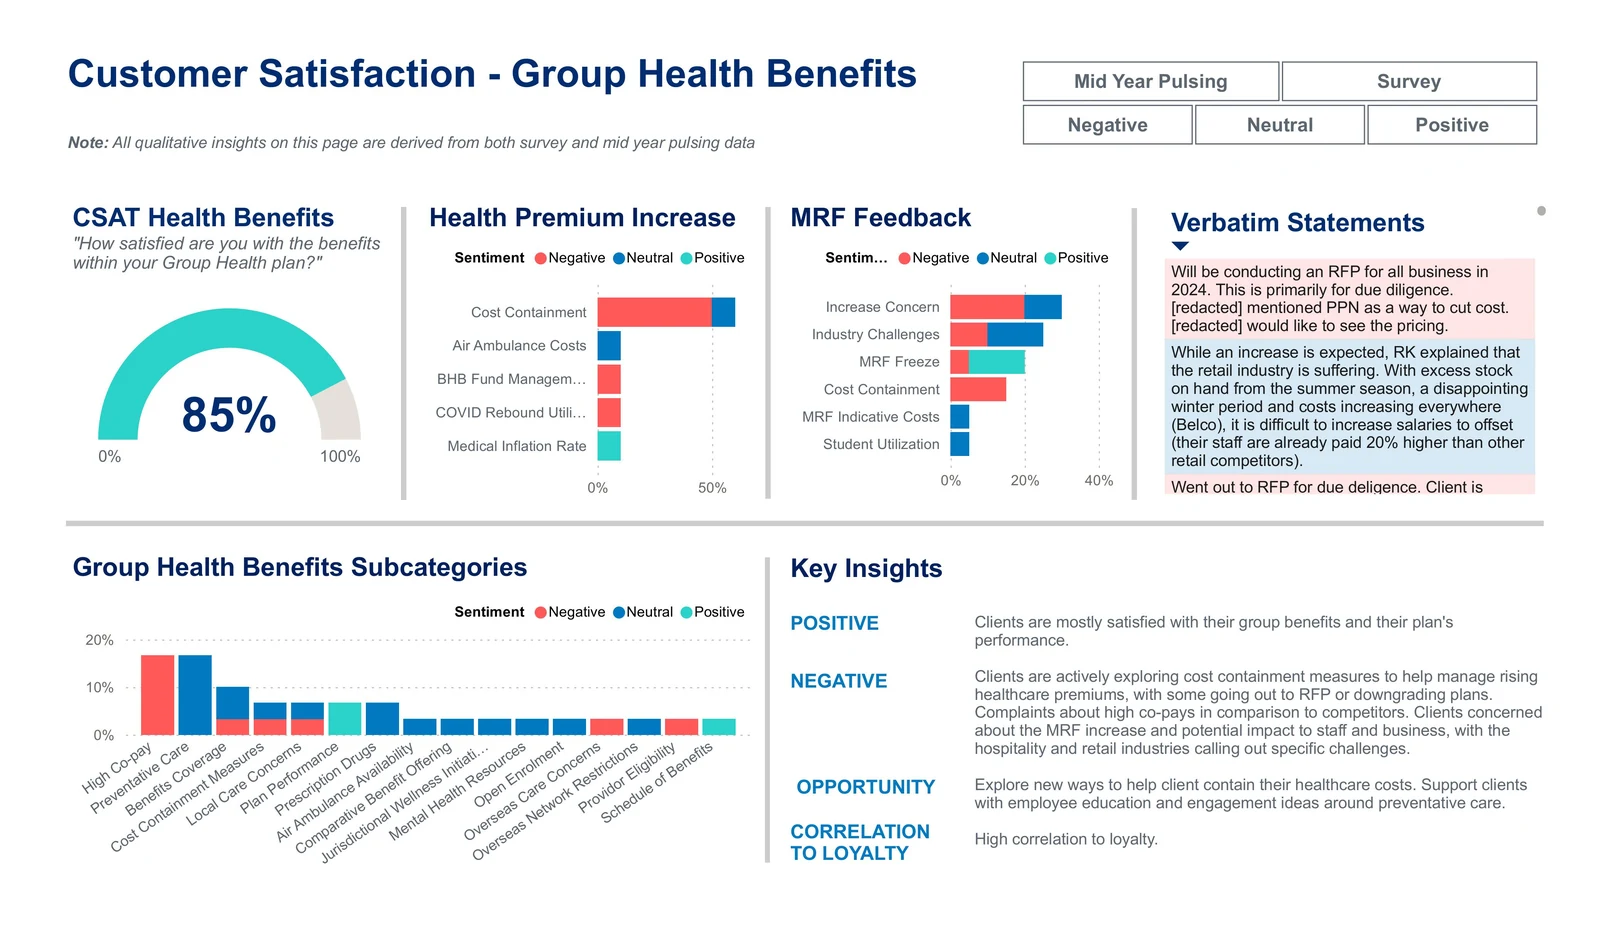
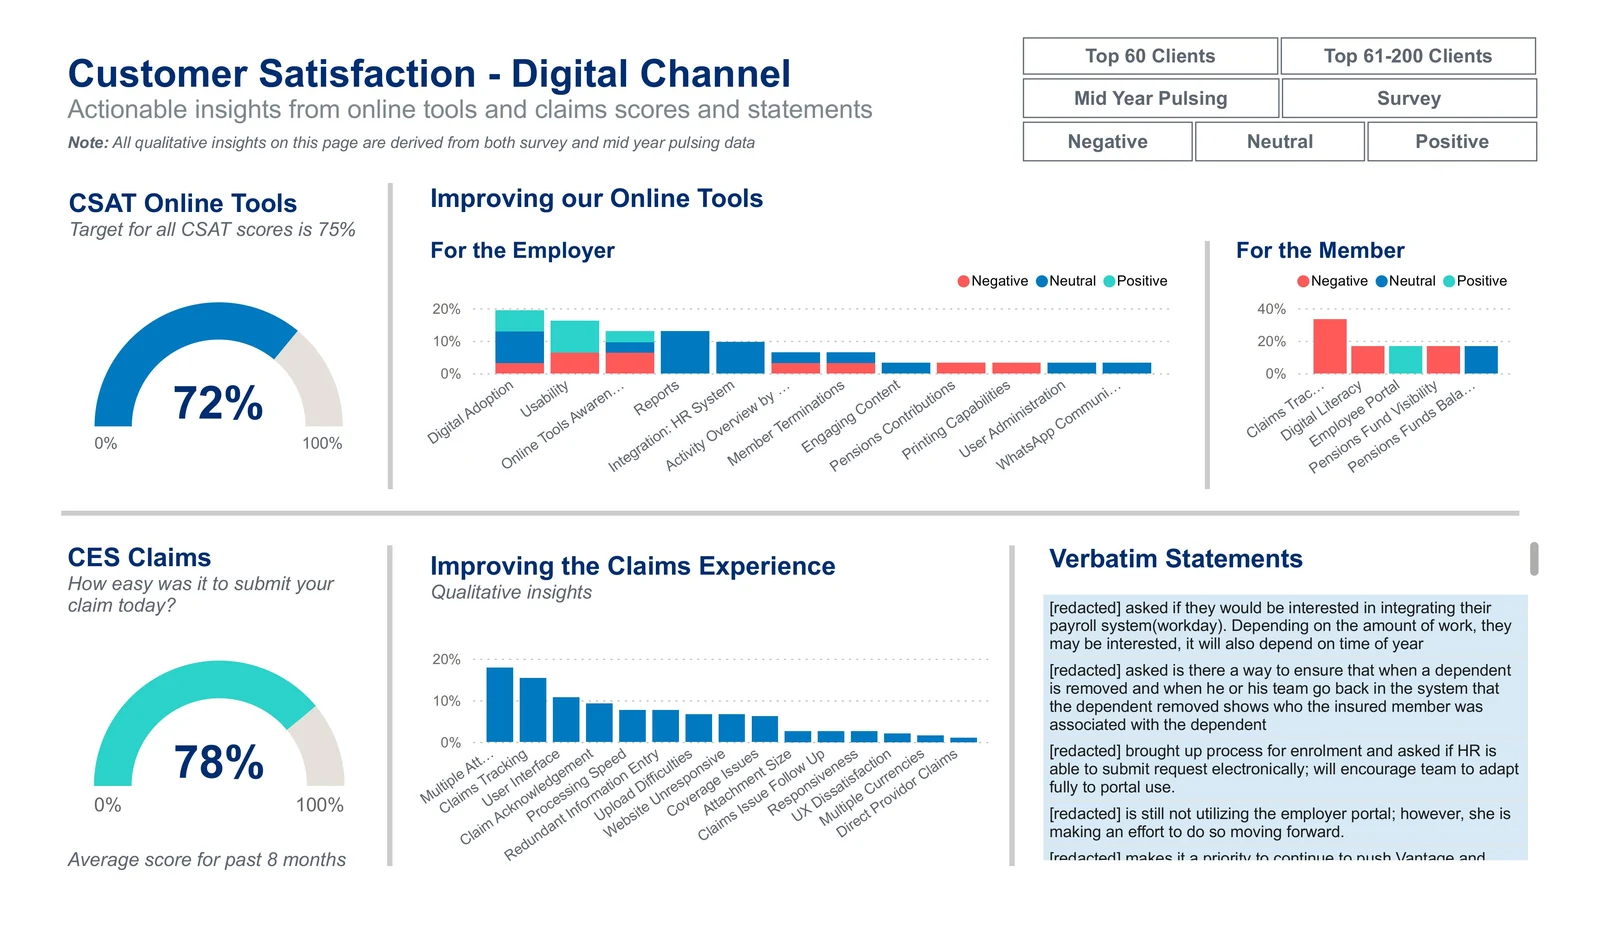
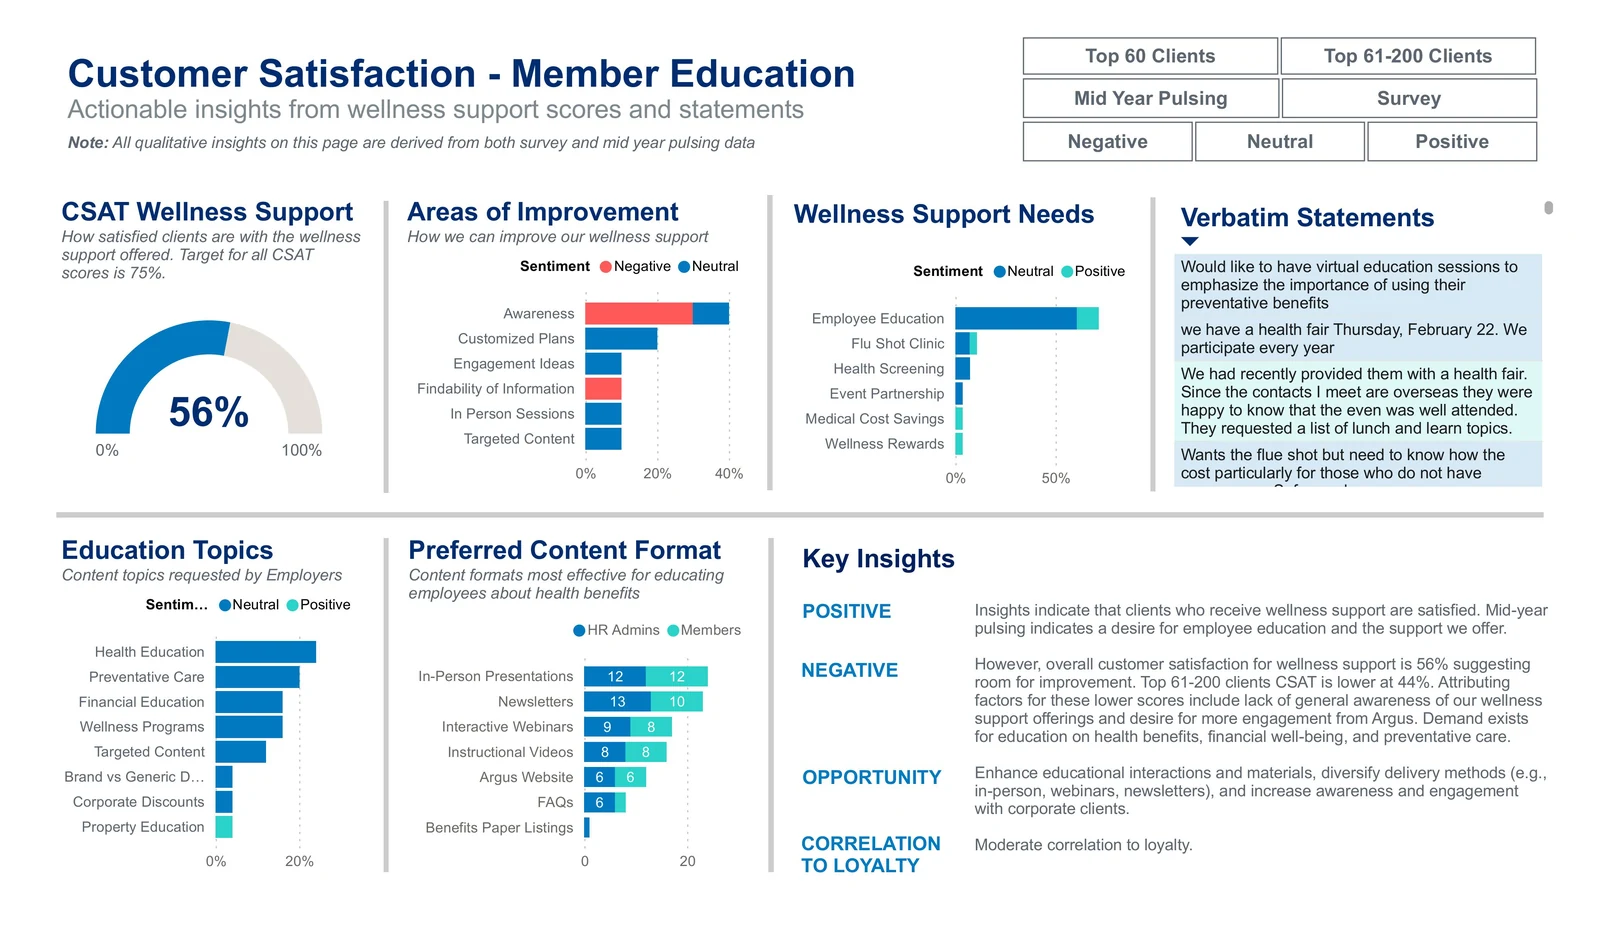
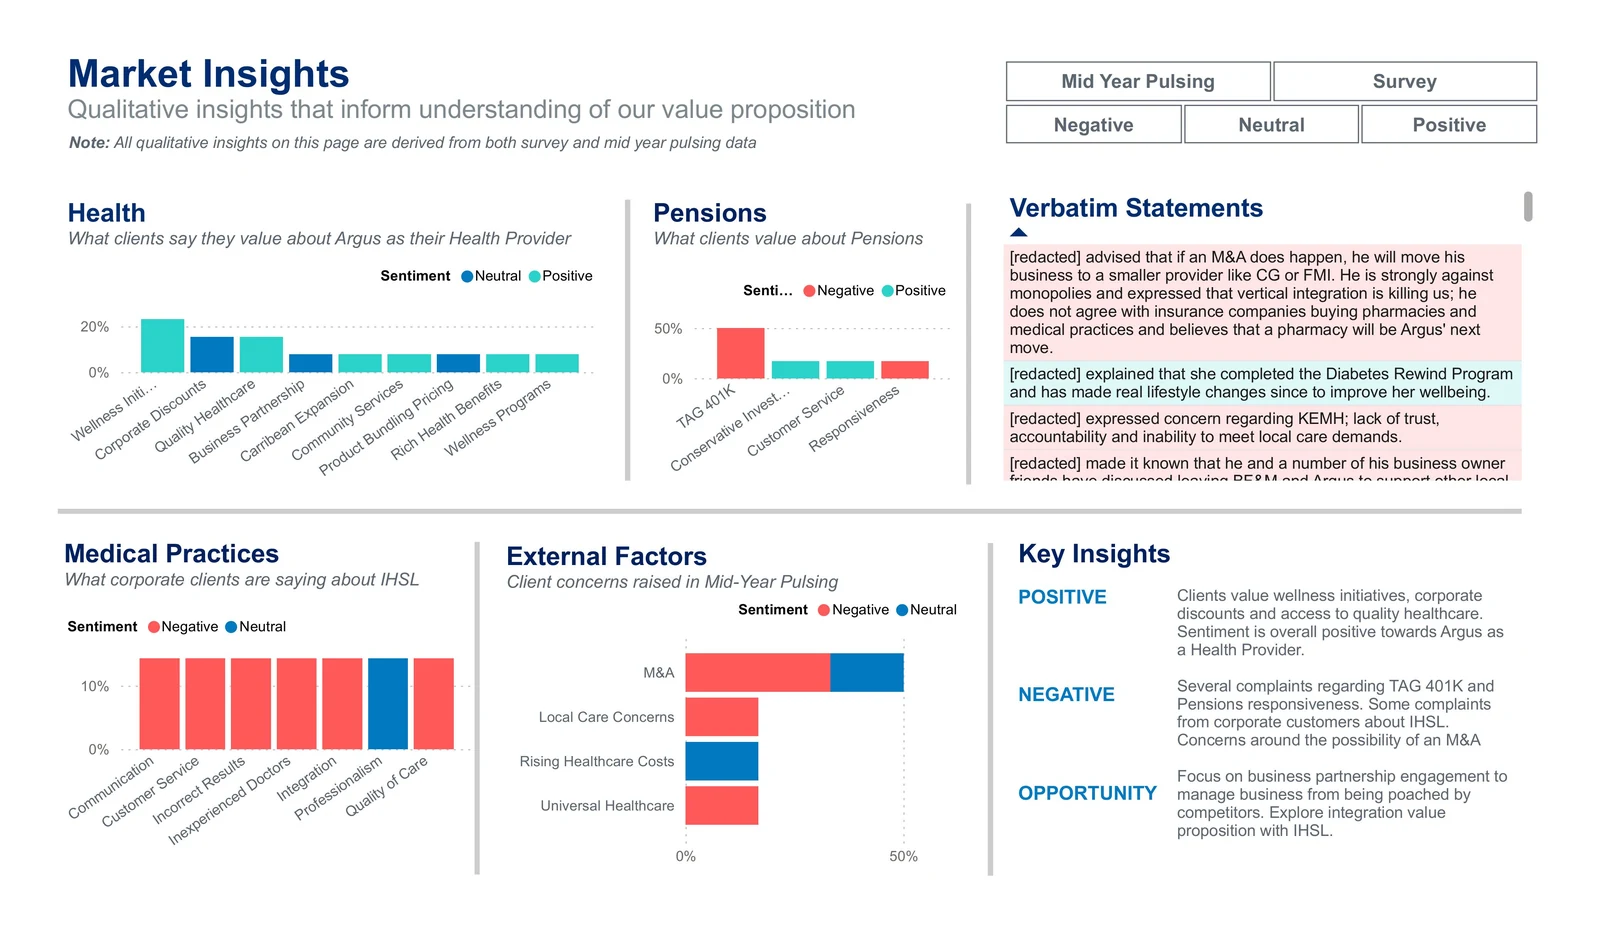
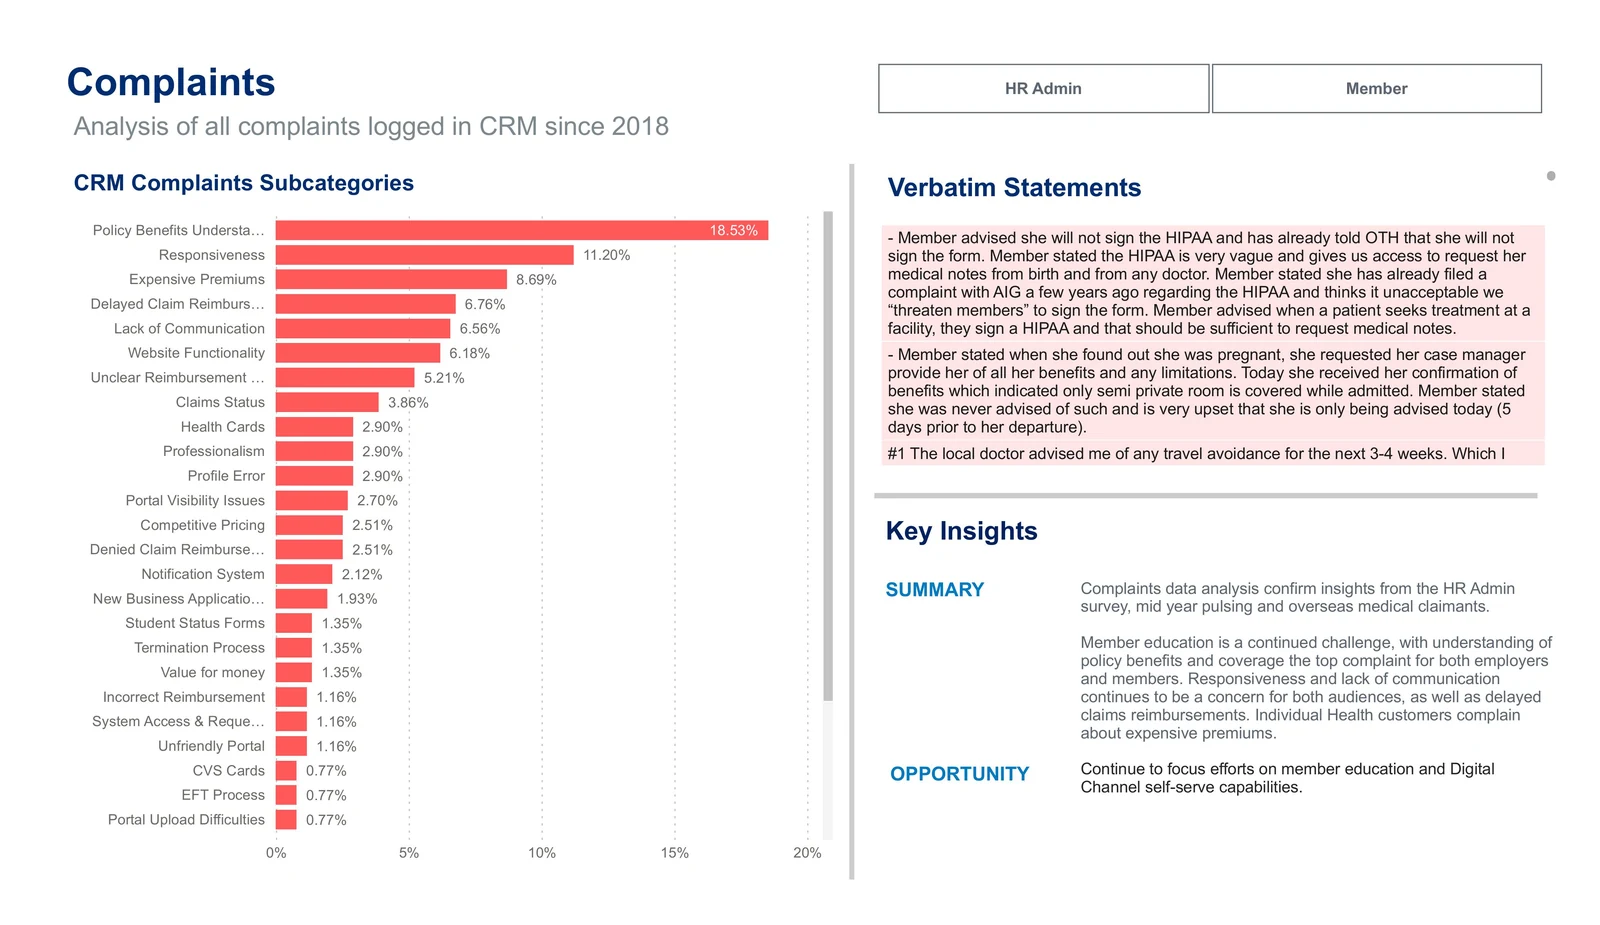
Pages from the VoC report/dashboard. (Sensitive client and business data have been removed for portfolio use.)
04. Key Insights
Customer satisfaction (CSAT) · 0–100% scale
75% study target
Relationship management88%13 pts above target
Online tools72%3 pts below target
Wellness support56%19 pts below target
Relationship management
Relationship management was a strength, but expectations extended beyond service.
Relationship-management measures performed above target and showed a strong relationship with loyalty. Qualitative feedback, however, showed that clients wanted more proactive communication, faster transactional support, and greater involvement in their broader business needs.
Digital tools
Digital tools were one of the weaker parts of the experience.
Satisfaction with online tools fell below the study target. Feedback pointed to usability and awareness issues, along with specific needs around claims tracking, plan administration, reporting, and integration with existing HR systems.
Member education
Member education was an unmet need.
Wellness support also scored below target. Customers frequently requested more education around benefits, preventative care, financial wellbeing, and wellness programs, as well as more accessible formats such as presentations, webinars, and newsletters.
05. Impact
The findings were presented to customer-facing, product, and digital teams and used to prioritize improvements across the four experience areas identified in the study. In the following reporting cycle, average CSAT across these areas increased by 18%, while NPS increased by 24 points. The study also created a baseline for future VoC reporting, allowing subsequent research to compare changes in satisfaction and loyalty against the initiatives introduced following the initial findings.